$WHATC Rips 956%, Then Runs Straight Into the First Exit Test
$WHATC turned a self-deprecating meme into $2.08M of first-session volume on Robinhood chain, but the 45% hourly drawdown says the real story is whether buyers can absorb the first wave of profit-taking.
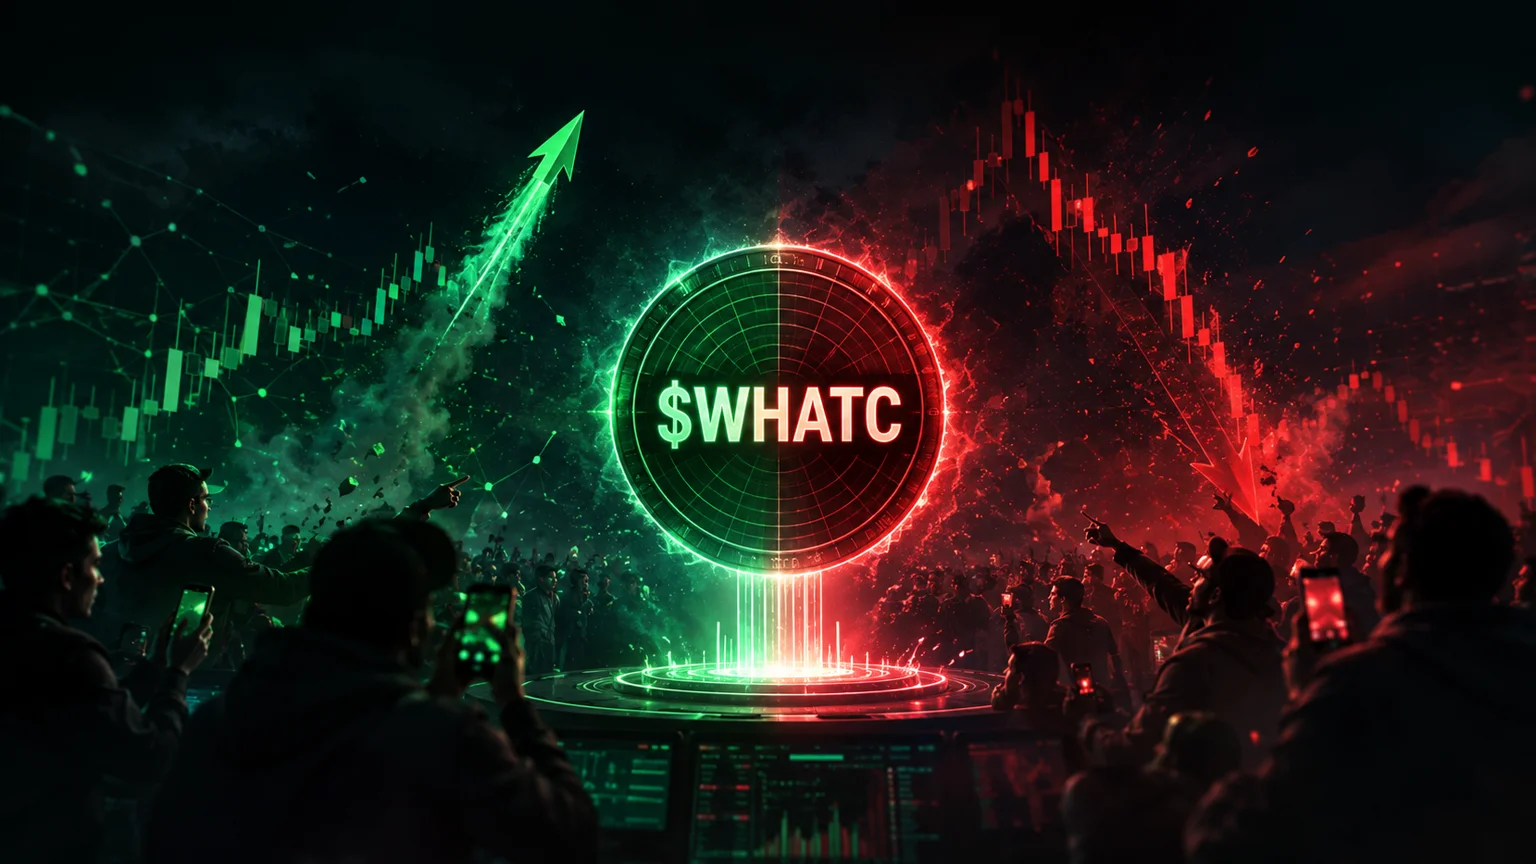
$WHATC is not subtle. A token called What can I lose launched on Robinhood chain and immediately behaved like the name was daring the market to answer. In less than four hours, the pair pushed roughly $2.08 million through the book, printed a 956% 24h move, and dragged a $597.5K market cap into view before the first real recoil hit. That is enough activity to earn a launch-radar read, but the shape of the move matters more than the headline percentage.
The tape has two competing messages. Buyers still dominate the full-day transaction mix, with 13,664 buys against 3,106 sells, or about 81.5% buy-side flow. At the same time, the latest one-hour move is down 45.47%, which means the first chase wave already met sellers willing to hit the bid. That is the difference between a clean runner and a post-pump exhaustion test: the market can be loud, liquid enough to trade, and still structurally fragile.
- → $WHATC has the attention: about $2.08M in 24h volume on a pair less than four hours old.
- → The buy ratio is heavy at roughly 81.5%, but the one-hour candle is already down 45.47%.
- → Liquidity is only about $71.5K against a $597.5K market cap, so the first exit test is the real signal.
The Joke Is Doing Real Volume
The best meme tickers often compress the whole trade into one sentence. $WHATC does that cleanly. What can I lose is the type of self-roast phrase that works because every buyer already knows the answer. It gives the market a wink, not a whitepaper. On a fast chain rotation, that can be enough to get the first screen of traders clicking, sharing, and asking whether the joke has legs before the second hour has even closed.
That is why the volume matters. A $2.08 million turnover print at a sub-$600K market cap is not passive chart drift. It says $WHATC found a pocket of active speculation quickly, and the transaction count backs that up. More than 16,700 trades in the first session means the move was not just one whale candle sitting in an empty pool. There is a crowd here. The question is whether that crowd is accumulating a meme or simply trading the first violent loop.
What the On-Chain Data Shows
$WHATC is currently trading around $0.0005975 with a market cap and FDV near $597.5K. Reported liquidity is about $71.5K, which is the number that should keep the read grounded. The token can post a huge volume headline because buyers and sellers are rotating through the pool at speed, but the pool itself is still shallow relative to the attention. When volume is roughly 29 times liquidity, slippage and sudden repricing become part of the trade, not a side detail.
The buy/sell split is the strongest data point for bulls. A full-day flow of 13,664 buys and 3,106 sells shows broad demand on the available venue, and a 6.67% move in the latest five-minute snapshot says buyers have not disappeared. The problem is that the one-hour picture is much uglier. A 45.47% drawdown inside the same first-session window suggests early profit-taking is already heavy enough to erase a large chunk of the chase premium.
Holder concentration, insider wallet distribution, freeze authority, mint authority, and a Rugcheck-style risk score are not available through the same Solana data path because $WHATC is on Robinhood chain. That does not give the token a cleaner badge. It means the visible read has to lean on contract visibility, liquidity depth, transaction quality, and whether early supply behaves like a distributed meme or a small group using the first attention burst as an exit lane.
Why the Pullback Is the Story
A 956% launch move is easy to screenshot. The more useful read is what happens after the first buyers get paid. $WHATC already showed it can attract attention. Now it has to prove the chart can handle attention leaving and returning without turning into a straight-line bleed. That is a different skill set for a meme token. The first candle is about discovery. The next several UTC hours are about absorption.
The bear case is not that $WHATC failed because it pulled back. Early meme launches pull back all the time, especially when the market cap expands faster than liquidity. The bear case is that the pullback is happening while the pool is still thin and the token is still trying to define its holder base. If early wallets are selling into every bounce, the strong buy count can become misleading because retail buys may only be refreshing exit liquidity for the first wave.
The bull case is that the drawdown is the first flush, not the end of the bid. If $WHATC can keep five-minute demand alive, rebuild above the current liquidity pocket, and pull additional chain-native traders into the joke, the violent one-hour move may end up looking like a necessary reset. Meme markets forgive ugly wicks when the ticker remains culturally sticky and the next buyers are not arriving at a worse structure than the first group.
The Robinhood Chain Angle
The chain context makes this more than another random microcap sprint. Robinhood chain meme activity is still young compared with Solana launchpad culture, where traders are trained to parse every new pair in seconds. On a smaller meme venue, one loud ticker can become the day's scoreboard because there are fewer competing charts eating attention. $WHATC benefits from that scarcity. It does not need to be the best meme on the internet; it only needs to be the ticker traders see moving while they are looking for the chain's next reference point.
That scarcity cuts both ways. Fewer mature liquidity rails can make early winners feel bigger than they are, and a thin pool can exaggerate both sides of the move. A token with $71.5K of liquidity can look enormous while buyers are aggressive, then feel suddenly airless when the direction flips. That is why $WHATC belongs in the speculative bucket even with a strong activity score. The volume is real enough to watch. The depth is not yet strong enough to trust.
$WHATC is a real first-session attention event, not a quiet pair with one green candle. But a $2.08M volume print sitting over $71.5K liquidity means traders should treat the pullback as the main evidence, not background noise.
What Would Upgrade $WHATC
The cleanest upgrade would be liquidity growth without volume collapsing. If the pool deepens while $WHATC keeps trading actively, the market starts building a better base for a second leg. A healthier version of this chart would show the one-hour drawdown stabilizing, the buy ratio cooling from extreme levels into sustainable two-way flow, and the market cap holding above the first panic zone instead of grinding lower on every bounce.
A second upgrade would be stronger identity. The name is already good because it understands the audience, but good memes need repetition. The website and social presence give $WHATC somewhere for attention to land. Now the token needs the community to turn the phrase into a running bit rather than a one-chart joke. If the quote starts circulating beyond the chart watchers, the market gets a narrative reason to keep returning after the initial pump.
The Degen Read
$WHATC is exactly the kind of launch that tempts traders to overread the headline number. A 956% move, millions in volume, and an 81.5% buy ratio all sound like strength. They are strength, but they are not the whole story. The same data set says the token is young, thin, and already testing whether late buyers can handle a hard drawdown. That is not a disqualifier. It is the point of the article.
For now, $WHATC is a speculative post-pump exhaustion watch. The meme is readable, the volume is loud, and the chain context gives it room to become a reference ticker if traders keep caring. The caution is that the market has already shown how quickly the move can reverse. The next signal is not another percentage screenshot. It is whether liquidity, holders, and social momentum grow after the first exit test instead of only during the chase.
$WHATC earns a speculative watch because the first-session volume is too loud to ignore and the ticker has a clean degen hook. The one-hour 45.47% drop keeps it out of the clean bucket. Until liquidity grows beyond $71.5K and the chart proves buyers can absorb early sellers, this is a high-velocity meme signal with real upside and an equally real exit-door problem.
Why is $WHATC moving?
$WHATC caught a fast first-session bid on Robinhood chain, pushing about $2.08M in 24h volume and a 956% move while the market tested a simple self-deprecating meme.
What is the biggest risk with $WHATC?
The main risk is depth. Liquidity is about $71.5K against more than $2M in volume, and the latest one-hour window is already down 45.47%, so exits can get sharp.
Is $WHATC a clean signal?
Not yet. The demand is real enough to track, but the early pullback and shallow liquidity make it speculative until the market shows better absorption and a broader holder base.